I watched most of Chamberlain's outings last year, and I noticed that his slider looked much different at the end of the season than it did previously. What I thought saw was increased velocity, along with less movement and more "hanging pitches."

By looking at the above graph, which shows the average slider velocity in each of Chamberlain's 31 starts, it's clear that something happened to his velocity at the beginning of September. Using this as a guide, I decided to split up Joba's sliders into a September and pre-September set (unfortunately creating a much smaller sample size for one of the groups). Honestly, I expected to see a huge discrepancy in terms of results, but this was not the case at all:
| Avg. Speed | pfx_x | pfx_z | |
| 4/09-8/09 | 84.22 | 2.06 | -0.70 |
| 9/09 | 86.16 | 1.14 | 1.71 |
| Pitch# | Swing% | Whiff% | Wide Zone% | Chase% | Watch% | RSv/100 |
| 509 | 48.3% | 41.1% | 51.5% | 35.8% | 39.7% | 1.37 |
| 89 | 53.9% | 45.8% | 52.8% | 41.7% | 40.4% | 1.41 |
| Avg. Speed | pfx_x | pfx_z | |
| 4/09-8/09 | 92.52 | -3.88 | 9.91 |
| 9/09 | 92.55 | -5.32 | 10.27 |
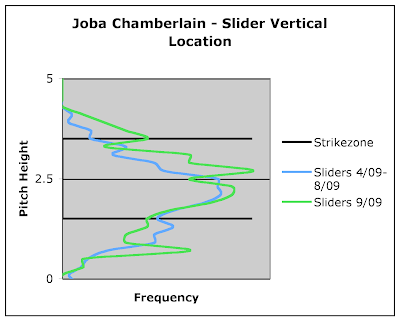
The green spike above the middle of the strikezone is clear to see, and it would indicate that Chamberlain was hanging a greater percentage of sliders in the upper half of the zone in September than earlier in the year. Even though he got similar results with his slider in September, as I showed above, it's certainly not a good thing to leave too many sliders up , which he was doing to an extreme in the postseason.
Gameday PITCHf/x data is from MLB Advanced Media; it can be easily accessed via this tool.
Gameday PITCHf/x data is from MLB Advanced Media; it can be easily accessed via this tool.


No comments:
Post a Comment