A Baseball Weblog

Tuesday, August 31, 2010

Chapman brings the heat

Aroldis Chapman made his much anticipated debut earlier this evening, and he did not disappoint. He pitched a perfect 8th inning with a strikeout and two weak ground outs, and it would be an understatement to say that he lit up the radar gun. Six of his eight pitches were fastballs (the other two were sliders). Here are the velocities of his fastballs:

98.4
102.5
100.3
102.7
101.4
98.6

With his second pitch registered at 103 mph, he passed Bobby Parnell (who threw a pitch gunned at 102.5 mph a few weeks ago) as the max velocity leader in 2010. In case you're wondering, Chapman's fastballs average out to 100.65 mph, which is fairly ridiculous. The last pitcher to throw a pitch as hard as Chapman did tonight was Joel Zumaya, who threw two pitches at 102.7 in June of 2009.

Gameday PITCHf/x data is from MLB Advanced Media.

Sunday, August 29, 2010

Lilly's interesting line

Ted Lilly's line from his Sunday start against the Rockies caught my eye:
4 IP, 9 H, 7 R, 7 ER, 1 BB, 8 K

I wouldn't expect a pitcher who strikes out 8 in 4 innings to have such poor results. Similarly, I wouldn't expect a pitcher who only walks one in 4 innings to have such poor results. You can imagine my curiosity when I noticed Lilly's combination of an 8/1 K/BB ratio and 7 runs allowed in those 4 innings. Overall, Lilly faced 22 batters. Take out those 8 strikeouts and 1 walk, and you have 13 balls in play. Of those, there were 9 hits, including 2 home runs. That's a batting average on contact of .692, which is more than double the league average. Obviously not significant, because of the sample size. But, noteworthy, I suppose.

Friday, August 27, 2010

Stephen Strasburg needs Tommy John surgery

Stephen Strasburg has an elbow tear, and will likely undergo Tommy John surgery. This will keep him out of baseball likely until 2012. Surely, this is extremely depressing news for everyone who is a fan of baseball - all the baseball junkies who love those 100 mph fastballs, the Nationals' franchise and fans who were looking for him to help turn around Washington baseball, and, most of all, for Mr. Strasburg himself. Obviously, there have been many pitchers who have undergone Tommy John surgery and have made it back just as strong or even stronger, but there's always risk with surgery, no matter how common-place the procedure. Even if he does come back just as healthy, this causes all sorts of problems for the time being. I heard Tim Kurkjian of ESPN say earlier today that even with someone like Kerry Wood, who was considered such a top prospect in 1998, it was a different situation because the Cubs had an established fan base and franchise. The Nationals pretty much built their plans around Strasburg, and now they're going to have to figure out how to get by not only without their best pitcher, but also without their main attraction. Fans would come from all over to see him pitch; I can safely say that there was no one in baseball who had that kind of effect. This is a sad day for baseball.

Wednesday, August 25, 2010

Rafael Soriano's immaculate inning

Oh, I forgot to post this earlier. In Monday's Rays-Angels game, Rafael Soriano pitched an immaculate 9th inning - three strikeouts on nine pitches. According to The Immaculate Inning website, this was the 44th occurrence in Major League history of such an inning. Soriano struck out Erick Aybar, Mike Napoli, and Peter Bourjos on the minimum number of pitches, with six swinging strikes, two called strikes, and one foul ball. Ross Ohlendorf was the last pitcher to have an immaculate inning, performing it on September 5th of 2009.

Tuesday, August 24, 2010

Nova's first start

Ivan Nova made his first career start yesterday, and he did a good job. It's easy to overlook Nova's effort given the two dramatic home runs by Jose Bautista, Bautista's antics, Brandon Morrow's 12 strikeouts, Jerry Meals' inconsistent strike zone, two Toronto ejections, and a near brawl in the sixth inning. Yes, it was a fun and eventful game. But Nova's pitching, other than throwing up and in to Bautista after his first home run, wasn't really that eventful at all. After he got out of a tough first inning in which he loaded the bases with nobody out (helped by a double play turned by Brett Gardner and Francisco Cervelli), he just went about his business, getting groundballs and keeping the Jays from scoring. Except, of course, for the two-run homer by Bautista in the 3rd inning. His final line for the evening was 5 1/3 innings, 6 hits, 2 runs (both earned), 1 walk, and 3 strikeouts. That's a game score of 50, which is exactly average.

Nova went to work with four pitches: a fastball, a hard curveball, a hard changeup, and a slider that the YES Network's Jack Curry said that he is still developing. The velocity exceeded expectations, lighting up the gun at 98 mph (97.5) in the first inning and averaging 94-95. The curve was typically in the low 80s, the slider a bit more than that, and the change a bit more than the slider. Nova appeared to have best command of the fastball, on which he got two swings and misses and generated 9 ground balls out of 13 balls in play. I think it's a four-seamer, maybe a combination of a four-seamer and a two-seamer, but whatever it is, it gets some good dropping action relative to the average fastball, which leads to lots of grounders. A bit less than a third of the 73 pitches Nova threw were fastballs; he had a tougher time commanding the 23 offspeed pitches. Of those pitches, 20 were out of the strikezone, and only four of those pitches were chased (all of them changeups). In addition, it was a hanging slider that Bautista was able to hit out of the park in the third inning.

Now, the Yankees have to figure out whether or not Nova was good enough for another start. I'm interested to see what they come up with.

For those who are interested, below I've included the average pitch movement for Nova's start. It's from the catcher's perspective, so pitches breaking armside (from a righty) will have negative horizontal movement. Also, it's relative to a theoretical pitch without spin. I mentioned the extra "drop" on Nova's fastball earlier; the average big league fastball "rises" (compared to the spinless pitch) 9-10 inches, while Nova's only "rises" about 7.5. Of course, this becomes more significant when compared to other parks, but the Toronto system seems like it's calibrated well, and the fastball movement would explain the groundballs. Some video of his pitches is here.

Monday, August 23, 2010

Welcome, Ivan Nova

The Yankees called up Ivan Nova over the weekend and will give him the start against the Blue Jays later today. He was up with the big club back in May, but he only pitched three relief innings over two games. Just a bit of background on Nova ...
He was born in San Cristobal, Dominican Republic, in 1987, and was signed by the Yankees in 2004. He's been solid throughout his minor league career, and has never reached Baseball America's list of Top 10 Yankees prospects. He's billed as a guy who works down in the zone with plus velocity, sometimes reaching as high as 97 mph. Here are some results from the minors:

YearClassIPERAFIPK/9BBHBP/9GB Rate
2006Rk43 2.723.737.532.09.443
2007A99 1/34.984.284.893.35.472
2008A+148 2/34.363.336.603.21.507
2009AA-AAA139 1/33.683.945.814.13.544
2010AAA1452.863.527.143.04.517

MiL575 1/33.803.726.323.33.508

About Nova and the starting situation, Girardi had this to say: "The greatest problem to have would be if he pitches extremely well on Monday." This is true in that it is both a problem that many teams would want, and also one that Girardi's going to have to give some serious thought to. Let's say Nova pitches very well today. I think it would be pretty difficult for the Yankees to not give him another shot, given how A.J. Burnett and especially Javier Vazquez have been pitching recently. But would that mean that Vazquez is just gone from the rotation? Does he go to the bullpen? Is it logical to put Nova in the rotation based on one (hypothetical!) good start? This is something for Girardi and the Yankees to figure out.

Data are from Fangraphs and Minor League Splits.

Friday, August 20, 2010

Yankees' pitch times

Quantifying which pitchers are quick workers has always been intriguing to me. The PITCHf/x data has a time-stamp that goes down to the second, so with some Excel manipulation (I'm learning!), it is possible to get a feel for. I haven't seen a whole lot of work done on the subject, other than a few articles by PITCHf/x guru Mike Fast. Anyway, I attempted to test out some pitch times on the Excel file with the Yankees' 2010 data. I had to set a few different parameters to make sure that the data was accurate. I eliminated: the first pitch of each plate appearance so that I wouldn't get the time between each PA; all pitches with runners on base since the data doesn't detect pick-off attempts; and all intervals of either 0 seconds or greater than 1 minute since they either represent either an error in the data or a game delay. The quickest worker on the Yankees so far this year is Dustin Moseley, who takes an average of 18.3 seconds between each pitch. Joba Chamberlain is the slowest, averaging almost 26 seconds. The data looked realistic, but all I had to compare it to was one 2008 article by Mike Fast on his blog, in which he displayed the pitch times for the pitchers of all 30 teams. I got in touch with Mike a few days ago, and it seems like we're using similar parameters. For the Yankee pitchers who have pitched in 2008 and 2010, here is how my data compares to Mike's:

Name2008 Time (in seconds)2010 Time (in seconds)
A.J. Burnett24.724.7
Andy Pettitte22.122.3
Boone Logan21.423.5
CC Sabathia23.724.5
Chad Gaudin20.620.8
Chan Ho Park22.822.8
Damaso Marte21.522.9
Dustin Moseley22.718.3
Javier Vazquez22.923.2
Joba Chamberlain25.125.9
Kerry Wood20.720.5
Mariano Rivera22.721.4
Phil Hughes25.123.5

It looks legit. This is pretty exciting. I'll do a lot more with this in the future.

Further reading: Mike Fast did another article on pitch times, this one for The Hardball Times, in 2008.

Wednesday, August 18, 2010

Observations, rhetorical questions, and a lack of answers about Chamberlain

Watching Joba Chamberlain pitch out of the bullpen this year, I've made some observations. Three platoon-related things that I've recently been thinking about are ...
a) He really likes to throw outside fastballs, both to lefties and righties
b) For some reason, he throws harder against righties
c) I feel more confident in his abilities when he's facing righties

What I see/remember and what the facts are frequently differ, so I decided to check out some pitch data on Chamberlain this year to see if what I thought meshed with reality. First, the pitch locations. This chart shows the approximated frequencies (smoothed by Excel trendlines) of Chamberlain's four-seamer location to righties (blue) and lefties (red).

The peaks of both curves are both on the outer half of the plate. This is pure speculation - Chamberlain led the majors in hit batsmen last year with 12, and quite possibly got a reputation for being a head-hunter after his really weird beanball thing with Kevin Youkilis (there were also minor incidents with Jason Bay and Evan Longoria last year). Is it possible that he's trying to shake that label by pitching inside less? Well, before putting any stock in that whatsoever, I looked back at his 2009 data to see if there were similar trends among pitch location. Turns out there were, though they were less exaggerated:


Maybe there's something to it. Chamberlain hasn't hit anyone this year, and he's one of only six relievers with a minimum of 50 IP with that distinction. Moving on ...

I had a suspicion that Joba was throwing his hardest against same-handed batters. Whatever the reason, that is in fact the case:

+--------------+--------------+
|FF mph to RHB-|FF mph to LHB-|
+----------------+------------+
|----94.97-----|----94.02-----|
+--------------+--------------+

This leads in nicely to my final point about Chamberlain - I've just been feeling better recently when he faces right-handers. But why? Here are a few splits.

+------+-----+-----+--------+------------+------------+------------+
|------|K/9--|BB/9-|GB Rate-|Whiff Rate--|Chase Rate--|Zone Rate---|
+------+-----+-----+--------+------------+------------+------------+
|vs RHB|9.31-|2.79-|.506----|.240--------|.323--------|.523--------|
+------+-----+-----+--------+------------+------------+------------+
|vs LHB|9.78-|3.52-|.484----|.182--------|.282--------|.391--------|
+------+-----+-----+--------+------------+------------+------------+

Alright, but those averages are skewed by the different pitch mix against righties and lefties:


+----------+------------+------------+------------+------------+
|----------|Pitch%------|Whiff Rate--|Chase Rate--|Zone Rate---|
+----------+------------+------------+------------+------------+
|FF vs RHB-|.591--------|.138--------|.288--------|.566--------|
+----------+------------+------------+------------+------------+
|FF vs LHB-|.722--------|.078--------|.211--------|.407--------|
+----------+------------+------------+------------+------------+
|SL vs RHB-|.372--------|.366--------|.384--------|.453--------|
+----------+------------+------------+------------+------------+
|SL vs LHB-|.157--------|.432--------|.615--------|.361--------|
+----------+------------+------------+------------+------------+

Now we're getting somewhere. Chamberlain has better control against right-handers, as evidenced by the lower walk rate and higher strikezone rate for the fastball. The whiff rate for the fastball is much better to righties. Is that directly caused by the better velocity? And is better velocity due to being in more pitcher's counts? These are questions that are tough to answer, particularly given the small sample sizes. The slider looks like a more effective pitch to lefties for some reason, but he only goes to is 16% of the time - again, this is probably related to worse control. Maybe the pitch's effectiveness against lefties is due to the limited sample? Would being in hitters' counts more make him go to the slider more? That's a lot of questions that I don't really have answers to. That's for Chamberlain and Jorge Posada to figure out.

So, in conclusion, it looks like there actually was something to those three observations, but trying to rationalize them can get very confusing ...

Data is from MLBAM and Fangraphs.

Tuesday, August 17, 2010

Marcum's curveball was MIA against the A's

Just a quick note on something that I found interesting. Jays' starter Shaun Marcum pitched a brilliant game yesterday against the Athletics, going the distance while allowing only one hit (a homer to lead off the 7th) and one walk while striking out five. While following the game last night, I noticed that he wasn't throwing his curveball. It seemed particularly odd for him since he's not a hard-thrower. I looked back at his data this morning and it appears that this was the first game all year in that Marcum did not mix in a curveball. His mix of fastballs (straight, cutting, sinking), changeups, and sliders only gave him a range of about 10 mph from 78 to 88; I've also seen him drop the change into the low 70s from time to time, which he did not do yesterday. Marcum hadn't allowed a hit for the first 6 innings, so it might have been a matter of sticking with what worked for the first part of the game.

Gameday data is from MLB Advanced Media. By the way, Marcum's a very interesting pitcher given his ability to change speeds and inability to blow hitters away with his fastball. His repertoire certainly deserves a greater look.

Sunday, August 15, 2010

Hughes' declining strikeout rate

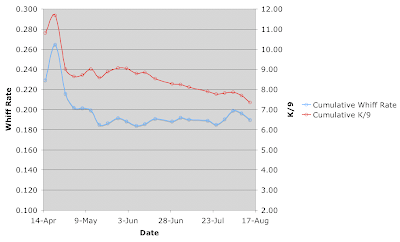
Phil Hughes picked up his 14th win of the season yesterday, allowing three runs in six innings to beat the Royals. He didn't record a single strikeout in the start, which is something he had only done one other time in his career (a 1 2/3 inning effort against the Orioles in 2009). Hughes' strikeouts per 9 innings rate now sits at 7.35, which is the lowest it's been all season. Through May, it was around 9, and through June it was in the 8s. Yet, Hughes has maintained a similar rate of contact throughout the season. I've prepared a two-axis graph with one side showing cumulative K/9 and the other showing cumulative whiff rate (swings-and-misses per swings), centered around approximated league averages for both metrics. I find plotting whiff rate and strikeouts to be significant since swing and misses correlate well with strikeouts.
Other than his first two starts of the season (the second of which was a 10 strikeout, 1 hit performance against the A's), his whiff rate has not seen the decline that his strikeout rate has --- in fact, his whiff rate is currently slightly higher now than it was in the middle of May. So, to me, it appears that the recent dip is more of a typical regression than a decline in ability.

Gameday data is from MLBAM.

WSJ on Brett Gardner

Link dump! I appreciated this recent article from the Wall Street Journal that details Brett Gardner's interesting (or not interesting, depending on how you look at it; I prefer the former) season at the plate. It's brief, but very informative.

Wednesday, August 11, 2010

If only he'd hit it in the air

Something that's great about Fangraphs and Baseball Prospectus is they allow you to directly download tabular data from the site. So, it makes it relatively easy for us to get answers to questions we may have. For example, I was thinking the other day about batters and homers per fly ball. HR/FB is a good thing to look at for hitters because it gives an extremely good look at raw power by isolating a lot of variables. Technically, HR/FB+LD could be better since line drives can turn into home runs, but HR/FB is a good baseline (and is what Fangraphs has). Anyway, I got to thinking about certain players who might not be maximizing their power by simply not hitting the ball in the air enough. So this morning, I took some Fangraphs data, put it in Excel, and plotted HR/FB along with flyball percentage.


As I had anticipated, there is some sort of correlation between FB% and HR/FB%. What I like to do with these graphs is gauge the overall strength of the correlation and then identify the outliers. The point furthest over to the right with a HR/FB of just under 20% represents Mark Reynolds' season. He obviously has great power, and maximizes it by hitting a lot of fly balls. Then there's the one up at the top, with a HR/FB of 26.7%. That's Joey Votto, who leads the league in HR/FB but only has a fly ball rate of .344. But the one that originally caught my eye was the point in the middle of the y axis but way off to the left. Say hello to Derek Jeter, who is having a rough season by his standards. At .728, his OPS is lower than it's been since 1995. At .111, his isolated slugging average is on par with where it was in 2008, in which he produced the lowest mark of his career. Yet, his HR/FB is above league average at 14.5%, and is also above his career average (going back to 2002*) of 13.1%. What gives? He's hitting the ball on the ground 66.8% of the time, which is a career high. And even with the increase in groundballs, his batting average on balls in play (.311) is significantly lower than his career average (.357); the extra groundballs don't seem to be helping him at all.

By the way, the discussion of Jeter or any other player in a post like this serves simply to point out an anomaly; the point of this is not to suggest that Derek Jeter hit more flyballs, even if such an adjustment wound up being beneficial to his performance.

Data are from Fangraphs and Baseball-Reference. *2002 is when Baseball Info Solutions started tracking batted ball data.

Rivera's mistake

Last night, Mariano Rivera had an uncharacteristic outing in that he allowed four men to reach base in less than an inning. First, he faced Michael Young, who hit an infield single. This is where each pitch to Young crossed the plate:


With a runner on first, Rivera then had to battle Josh Hamilton, who found a hole between first and second.


With two runners on, Vladimir Guerrero came up and sent a first pitch sinker to the left side. It wasn't hit hard at all, but it would have been another hit if not for a diving and (then) game-saving stop by Alex Rodriguez.


With first base open, the Yankees elected to walk Nelson Cruz and put the force play at every base, bringing up David Murphy with the bases loaded. This was where Rivera made his only mistake. He fell behind 3-0 on Murphy with pitches that were, for him, wild. After battling back to make it 3-2, he was forced to throw a cutter too far to the center of the plate, and Murphy was ready for it.


To the first three hitters, Rivera made all the right pitches, but had terrible misfortune on the placement of the groundballs he induced. He then got too careful with Murphy, and paid the price.

Gameday screenshots are courtesy of MLB Advanced Media.

Tuesday, August 10, 2010

Quick Strasburg refresher

Stephen Strasburg will make his return to the Nationals' rotation this evening against the Marlins. The Nationals say he won't go more than 90 pitches. Before his bout with shoulder stiffness at the end of last month, he had a pretty ridiculous start to his career. In his 9 starts (spanning 54 1/3 innings), he struck out 75, walked only 15, and allowed 14 earned runs for a 2.32 ERA. His FIP and xFIP were even lower, at 1.89 and 2.15, respectively. Here is a brief reminder on his stuff, along with some pitch results.

Pitch Pitch# Pitch%
FF10745.4%
FT10712.6%
CU21325.1%
CH14216.7%

He has two kinds of fastballs (a riding four-seamer and a sinking one), a curveball, and a changeup.  They're all deadly.  The four-seam/sinker distinction isn't that clear in the data, so take it with a grain of salt.  I have the four-seamer averaging over 97 mph, and the sinker just under.  He's maxed at 100.4 mph with the four-seamer; that puts him tied (with Cardinals' reliever Mitchell Boggs) for 8th in the majors in maximum velocity, and in 3rd among starters (behind Justin Verlander and Ubaldo Jimenez).  The curveball breaks a lot and is as hard (82 mph) as many pitchers' sliders.  Likewise, his changeup (just under 90 mph) is as hard as many fastballs.  Something that's intriguing about Strasburg is that while he possesses the 100 mph fastball, he still uses over 40% offspeed pitches (25.1% curves, 16.7% changeups).
Whiffs are always fun, and with Strasburg, they're everywhere.  Here are his four pitches (again, I'm not entirely confident in the fastball classification) according to whiff rate, which in this case is swinging strikes divided by total swings.  The 2010 league averages come from an article posted on the Hardball Times by Harry Pavlidis, whose work is always first-rate.       


PitchWhiff RateLeague Whiff Rate
FF.223.164
FT.143.128
CU.356.261
CH.553.307
ALL.307.211

Strasburg's reliance on his off-speed pitches has helped him keep the ball on the ground at a solid rate. In graphical and tabular form, here is the full batted ball breakdown on the 121 Strasburg offerings that have been hit into play so far. (click for larger image)


There ya go. By the way, I'm sure I'll be posting about Strasburg A LOT in the future.

Gameday PITCHf/x data is from MLB Advanced Media; it can be easily accessed via this tool.

Sunday, August 8, 2010

Follow-up on Morrow's near no-no

I'm not a huge fan of the Game Score statistic, but it does give a good idea of how well a pitcher pitched. Well, if I'm doing my arithmetic right, Brandon Morrow's game score this afternoon was 100, which is insanely rare. Like, insanely rare. There were only two 100+ game score performances in the 2000s, supplied by Curt Schilling in 2002 and Randy Johnson in 2004. Both had scores of 100. For what it's worth, Kerry Wood has the highest game score for a 9 inning game, set in May of 1998 with his one-hit, no walk, 20 strikeout shutout. The Baseball-Reference Play Index (to which I am not subscribed) says that there are only 8 other 9 inning, 100+ game score games in history. I can guarantee that before long, there'll be a post on the B-Ref blog with more information about the historical implications of Morrow's outing.

Morrow's one-hitter

Brandon Morrow just missed no-hitting the Rays earlier this afternoon. After retiring 26 of the first 29 men he faced (two walks and an error behind him), he allowed an infield single (deflecting off the glove of Aaron Hill) to Evan Longoria with 2 outs in the 9th. Morrow struck out a ridiculous 17 batters, and got 20 swings and misses along the way. Against 72 swings, that's a .227 whiff rate, which is spectacular (but isn't far off from Morrow's average this year. That says something about his strikeout ability.). Walks have been a problem for Morrow, but he only allowed two free passes to the Rays. Factor in the complete game, one-hit shutout, and you get a Game Score of 100, which is the best in the majors for 2010. Congratulations to Mr. Morrow.

Gameday PITCHf/x data is from MLBAM.

Friday, August 6, 2010

Release points (focus on sidewinders and submariners)

I've started taking a more detailed look at release points. That's usually the first identification when watching a pitcher on television, before we can make any judgments on his stuff --- does he come from over the top? Three-quarters? Side-winding? Submarine? But while noting this when watching games, I for some reason didn't really take much time to observe release points as catalogued by PITCHf/x data (which, clearly, I am fascinated by). So, I will dedicate this post to data representations of release points. Before I get into the graph stuff, I'd like to note that what we consider the release point in the data to be is an approximation based on where the PITCHf/x cameras first detect the ball out of the pitcher's hand. So while it's not an exact representation of where the pitcher's arm is, it's the closest thing we have now.


The above chart (my apologies for the cluttered-ness) shows the release points for the pitchers who have thrown in 2010. It's from the catcher's perspective, so the points on the positive side of the horizontal axis are from left-handers, and the points on the negative side are from right-handers (with what is to my knowledge one exception, which I'll get to in a bit). There are also some stray marks outside of the clusters, which represent the arm-angles of the sidewinders/submariners. For the right-handers, the guys that are outside of the general cluster are Cla Meredith, Darren O'Day, Peter Moylan, Sean Green, Joe Smith, and Brad Ziegler. Green throws from about a foot more to the side than any of the other righties. Ziegler, who appears to be the only true right-handed "submarine" specialist, has the lowest vertical angle but releases the ball only about two and a half feet from the side. For the lefties, the outliers are Randy Choate, Javier Lopez, James Houser, Pedro Feliciano, Joe Thatcher, and Mitch Stetter. Choate looks like a submariner, while Stetter comes from a higher angle but releases the ball a remarkable four and a half feet away from the center of the plate.

The cluster to the right is for left-handers, and the cluster to the left is for right-handers, with the one exception that I alluded to before. This exception is Hideki Okajima, whose release point PITCHf/x picks up as being to the side of home plate where right-handers work from. As far as I know, Okajima works from the extreme 3rd base side of the rubber; he also has a straight over-the-top delivery, which would probably account for this anomaly. By the way, at the end of this post I will include links to video clips of Okajima and the other pitchers I've mentioned here.

One other thing that's important to note - this post was pretty "quick 'n' dirty," as the release points on the chart were determined simply by taking the average release point on all of the pitcher's pitches. That means that the pitchers who have at least one distinct release point (Jose Contrereas, for example) or pitch from both sides of the rubber (Ben Sheets) will be misrepresented. There are only a few pitchers I know of that vary their release points significantly, but at some point I'll go back and do some refining.

Gameday PITCHf/x data is from MLB Advanced Media, and can be accessed easily via Joe Lefkowitz's site. Here is some video, courtesy of mlb.com and YouTube, of the sidearmers and submariners I identified (as well as Okajima):
James Houser (limited MLB experience - the video is from YouTube and is of poor quality)