A Baseball Weblog

Friday, February 26, 2010

The Yankees' bullpen candidates, part 1: Damaso Marte


Just for fun, I'm going to be profiling some of the Yankees' bullpen members over the next few posts. I've already covered Phil Hughes twice, as well as Sergio Mitre and Chad Gaudin. Though I would like to deconstruct the ridiculousness that is Mariano Rivera, I'm not going to do that just yet. I'll kick off this series with one of the pitchers that has a bullpen spot locked up, Damaso Marte.

Marte is not a stranger to the Yankee organization. After being signed as an amateur free agent by the Mariners in 1992, he was granted free agency in 2000 and was subsequently picked up by the Yankees later that year. However, he wouldn't pitch a game for the Yankees in this stint, as he was traded in June of 2001 straight-up for Enrique Wilson. After pitching a half-season with the Pirates, he was traded to the White Sox, for whom he provided four productive seasons out of the bullpen: 259 innings over 279 appearances, 2.78 ERA, 3.38 FIP, 3.66 xFIP, 4.1 BB/9, and 9.8 K/9. He was traded back to the Pirates before the 2006 season, and he spent two and a half seasons in Pittsburgh before coming to New York as a part of the Xavier Nady deal.

Since his arrival in New York, Marte has had mixed results. His 7.11 ERA is dreadful, but his 3.83 FIP and 4.27 xFIP paint a more positive picture. He has maintained a 10.5 K/9 ratio in his 46 appearances (31 2/3 innings) with New York, which is encouraging. Damaso won over the Yankee Universe with his performance in the 2009 postseason, in which he pitched 4 innings over 8 appearances, allowing 2 hits (both against the first two hitters he faced in ALDS Game 2), no runs, while striking out 5.

Before I go on, I'm going to roll out a few of my favorite PITCHf/x charts and graphs on Marte. (NOTE! These are 2009 regular season numbers only.)


Avg. SpeedMax. Speedpfx_xpfx_zspin_dirPitch#
FF91.6194.37.339.40142.26153
FT91.6792.010.045.46118.743
SL80.8684.7-5.38-2.30284.3871
CH83.1584.47.905.13124.732

(click for larger image)


Swing%Whiff%Wide Zone%
FF43.8%29.9%43.8%
SL40.8%13.8%57.7%

42.8%24.5%48.5%


Despite being sidelined with a shoulder injury for most of the year, Marte still flashed decent velocity in 2009. It did take a dip from 2008, in which he averaged 92.4 mph. After all, he did miss four months last year with shoulder tendonitis, which is no minor injury.
Marte is a fastball/breaking-ball pitcher, and his breaking pitch (I'm calling it a slider here, but it's pretty slurvy) gets a few different looks to it. I was startled by how infrequently batters swung and missed at the slurve and how frequently they missed on the fastball. The slider was also in the strikezone much more frequently than the fastball, which is notable. These qualities probably contributed to Marte's 0.54 RSv/100 on the fastball and -2.94 RSv/100 on the slider.


What is in store for Damaso in 2010? Barring injury, he will be a member of the Yankees' bullpen, due to to his 3 year, $12 million contract. He obviously has the stuff and the track record, but due to the current depth of the Yankees' bullpen, could Marte work as a lefty specialist?
He slings the ball from a low three-quarters arm slot, and has had trouble with right-handed batters throughout his career. Here are some splits to ponder.


YearPlatoon Advantage xFIPK/9BB/9


vs RHBvs LHB
vs RHBvs LHB
vs RHBvs LHB
2002166
2.822.69
10.7410.74
2.612.76
2003160
3.793.22
9.4210.31
4.812.70
2004141
4.603.95
8.298.33
4.463.73
2005189
5.003.83
8.8712.52
7.255.87
2006161
5.282.76
8.4411.28
6.472.73
2007154
4.073.35
9.1211.44
2.814.58
2008122
4.452.54
7.8913.71
3.533.74


(Platoon Advantage is a measurement of how frequently a pitcher faced a same-handed batter; a score over 100 would indicate that a pitcher faced more batters of his handedness than the MLB average for that year.)

Given that the Yankees already have David Robertson, Alfredo Aceves, Chad Gaudin, Sergio Mitre, Phil Hughes and/or Joba Chamberlain, Boone Logan, and the newly-acquired Chan Ho Park in the mix for bullpen spots, Marte may wind up getting most work as a LOOGY. An extremely expensive one.

Gameday PITCHf/x data is from MLB Advanced Media; it can be easily accessed via this tool. Other statistics are from Fangraphs and Baseball-Reference.

Tuesday, February 16, 2010

More about Joba's slider


Back in October, I wrote about how Joba Chamberlain appeared to be losing command of his slider. In this post, I would like to return to that topic.

I watched most of Chamberlain's outings last year, and I noticed that his slider looked much different at the end of the season than it did previously. What I thought saw was increased velocity, along with less movement and more "hanging pitches."


By looking at the above graph, which shows the average slider velocity in each of Chamberlain's 31 starts, it's clear that something happened to his velocity at the beginning of September. Using this as a guide, I decided to split up Joba's sliders into a September and pre-September set (unfortunately creating a much smaller sample size for one of the groups). Honestly, I expected to see a huge discrepancy in terms of results, but this was not the case at all:


Avg. Speedpfx_xpfx_z
4/09-8/0984.222.06-0.70
9/0986.161.141.71


Pitch#Swing%Whiff%Wide Zone%Chase%Watch%RSv/100
50948.3%41.1%51.5%35.8%39.7%1.37
8953.9%45.8%52.8%41.7%40.4%1.41

The rates are extremely similar. He actually got more swings and misses on the slider in September, which I would not have expected. The pure stuff looks different, though. In September, the pitch was on average 2 mph faster than it was the rest of the year; it also cut an inch less horizontally and lost two inches of vertical drop. Maybe this is all just PITCHf/x variance? To try to get an answer, I did a quick look at the speed and movement of Chamberlain's fastballs from the same period.


Avg. Speedpfx_xpfx_z
4/09-8/0992.52-3.889.91
9/0992.55-5.3210.27

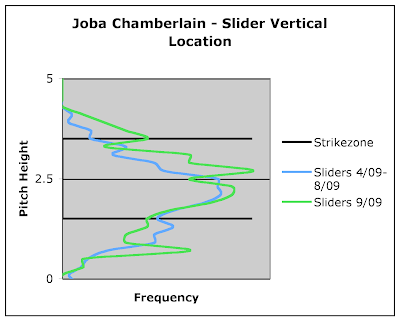
So yes, it is pretty clear that at least the velocity and vertical movement underwent a transformation at some point. Still, this doesn't tell us anything about the hanging pitches. Maybe this pitch height frequency chart can answer some questions.


The green spike above the middle of the strikezone is clear to see, and it would indicate that Chamberlain was hanging a greater percentage of sliders in the upper half of the zone in September than earlier in the year. Even though he got similar results with his slider in September, as I showed above, it's certainly not a good thing to leave too many sliders up , which he was doing to an extreme in the postseason.

Gameday PITCHf/x data is from MLB Advanced Media; it can be easily accessed via
this tool.


Saturday, February 6, 2010

Fun with plate discipline

A few days ago, I read an interesting article over on River Ave. Blues that measured the plate discipline of Yankees' hitters by their out-of-zone swing to in-zone swing ratios. In the article, Joe Pawlikowski noted that the point of the metric is to filter out the type of hitter that doesn't swing at all (there's a good post about this, too, using Brett Gardner as an example). Ideally, you want a player that doesn't swing at pitches out of the zone and swings at pitches in the zone, though players can obviously be successful as "bad ball" hitters (just ask Pablo Sandoval). Using Pawlikowski's metric as a model, I wanted to figure out for myself who had the best plate discipline in the majors last year. I used Z-Swing/O-Swing to make a higher number more favorable, and this was a raw ratio. In 2009, the average Z-O ratio was 2.63 (65.9% Z-Swing to 25.1% O-Swing). To make the overall number more presentable, I divided each player's Z-O ratio by the league average and then multiplied by 100 (the same scale as ERA+, OPS+, wRC+, etc.). Here's the top 5 for hitters, with a minimum of 500 plate appearances - and I must say that I was a bit surprised:


O-SwingZ-SwingRatioPlate Discipline Score
Chipper Jones.154.7274.72180
Marco Scutaro.123.5554.51172
Lyle Overbay.152.6274.13157
Luis Castillo.122.4904.02153
J.D Drew.153.6124.00152

No disrespect to any of the players on this list, but honestly, I expected to see Albert Pujols and/or Joe Mauer at the top. Pujols' PDS was 111, and Mauer's was 103. Let's look at the trailers in this category.


O-SwingZ-SwingRatioPlate Discipline Score
Chris Young.365.5251.4455
Erik Aybar.363.6201.7165
Bengie Molina.439.7701.7567
Alfonso Soriano.370.7221.9574
Kendry Morales.323.6381.9875

For what it's worth, the aforementioned Pablo Sandoval ranked 7th lowest on this list, with a PDS of 76.

I figured that a similar concept could be applied to pitchers in order to see which hurlers "fooled" opposing hitters most frequently. Here, a lower ratio is favorable for pitchers (though a higher PDS is still favorable). I plugged the formula into the 2009 statistics (qualified pitchers with 150+ innings), and came up with a pitching leaderboard:


O-SwingZ-SwingRatio Plate Discipline Score
Carl Pavano.316.6472.05128
Roy Halladay.314.6622.11125
Chad Billingsley.302.6432.13123
John Lackey.289.6212.15122
Dan Haren.288.6282.18120

Really? Carl Pavano? I can't say I would've guessed. Now I am obligated to show the bottom five:


O-SwingZ-SwingRatioPlate Discipline Score
Brad Penny.195.6983.5873
Jeff Suppan .206.6773.2980
J.A. Happ.208.6773.2584
Kenshin Kawakami.215.6743.1386
Aaron Cook.222.6903.1187

All I have to say is WOW, Brad Penny really wasn't fooling anybody last year.

A few closing thoughts: this is hardly a showing of a player's overall strength --- like I said earlier, there are certain hitters who can have success hitting pitches out of the zone, and there are certainly many pitchers who make a career out of in zone misses (a changeup artist like Cole Hamels, or a flame-thrower like Justin Verlander, as two examples). There are plenty of other ways I would like to deconstruct the data on this subject, but that will have to be for another post.
All data is from Fangraphs.